Ohio BWC's MCO Report Card: What Does It All Mean?
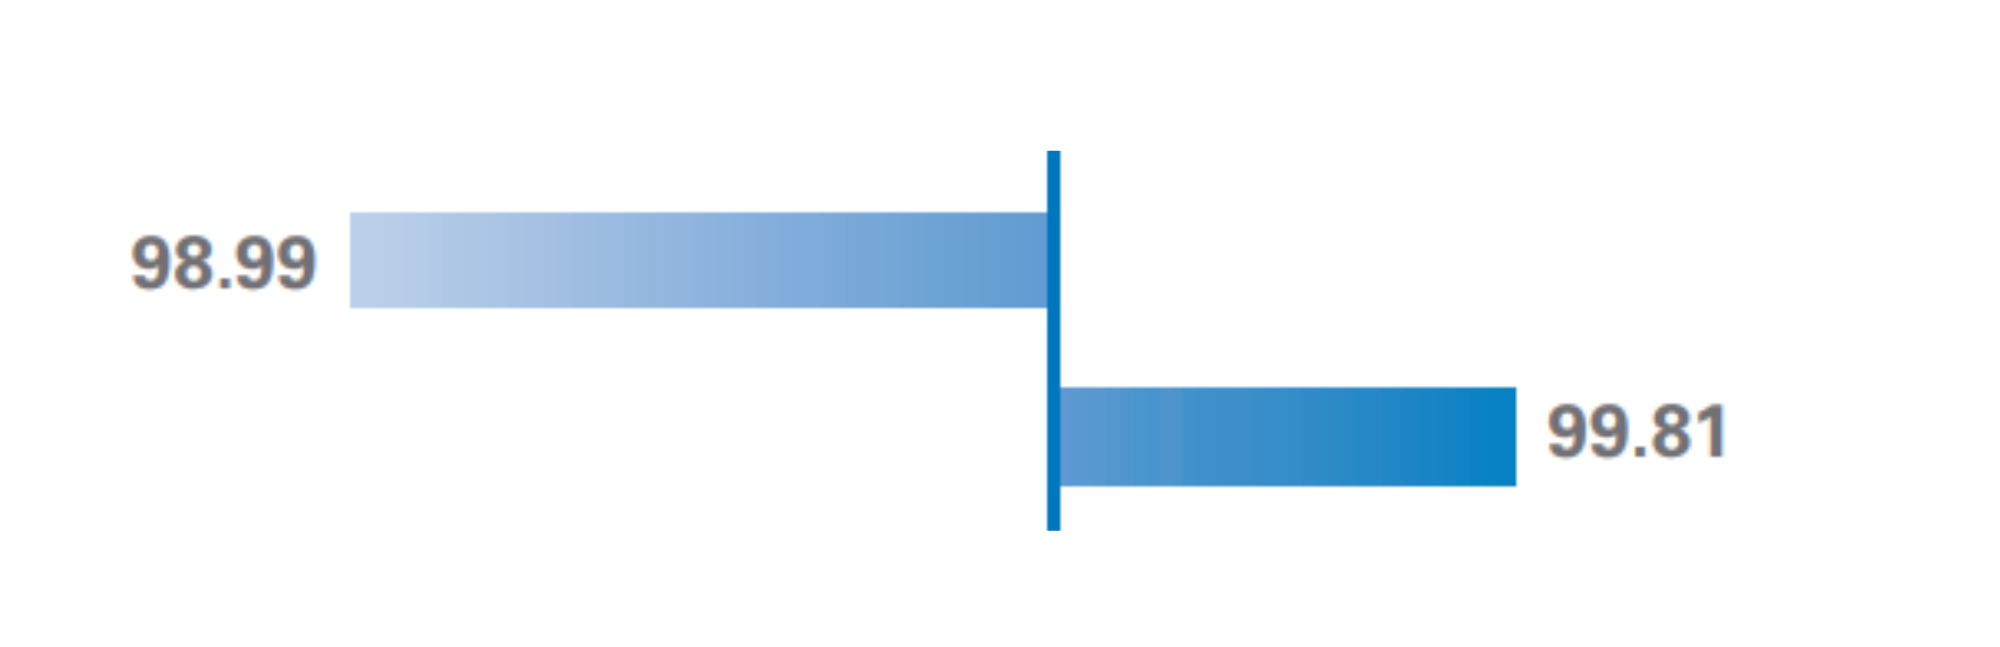
Every year, Ohio BWC releases the MCO Report Card, scoring MCOs in six categories. During MCO Open Enrollment every two years, the Report Card plays an important role in employers’ decision making. However, not everyone understands what all of these benchmarks mean, or they’re thrown off by how the numbers are represented. Most scores are represented in a horizontal bar chart with a vertical line representing the “statewide average” in that category. While the numbers may appear far apart visually, they may be very close in value. Here’s a great example, pulled from the 2023 Report Card’s Provider Bill Accuracy.

One would assume these figures are at least a few percentage points apart, right? Not so fast! They’re less than 1% apart. The graphic makes it seem like the MCO to the left is really dropping the ball, when in reality they’re only 0.59% behind their competitor to the right.
Be sure you’re looking at the actual numbers, not just visuals. It’s just as important to know what each category means, and why some of these benchmarks matter more to BWC than employers. The first two categories aren’t scores, but give you an idea of market share for each MCO. Page 2 shows the number of employers represented by each MCO, and how many active claims they were managing at the time the snapshot was taken. Page 3 showcases each MCO’s book of businesses across 12 industries. Everyone is close in market share – the biggest spread in any industry is 11% on the 2025 Report Card. It’s important to remember that “a claim is a claim.” Different industries have different needs, but that doesn’t mean one MCO will manage claims better for a trucking company because they have a higher market share in transportation.
The first scored category is FROI Timing. FROI is the acronym for First Report of Injury. This is an average of the amount of days between the date of injury (DOI) and a claim being filed with BWC. The quicker this happens, the quicker the injured worker will be assigned a claim number – which makes things like filling prescriptions and getting into physical therapy much easier.
FROI Turnaround scores are next. All MCOs are fairly close here, but faster is not always better. In this window of time, MCOs gather details from all involved parties and may communicate with your TPA on the matter. The MCO should verify all of the details and make sure there are no red flags prior to submitting. As an employer, you want your MCO to take the time to ensure the mechanism of injury lines up with everything else that’s been reported, as well as the medical necessity of treatments being requested.
Provider Bill Timing measures the average number of days between the MCO receiving the provider bill and when it’s submitted to BWC for processing. The report card states that lower numbers are better here, but consider that your MCO is taking time to review the bills to ensure they’re marked down to state fee schedule and free of errors. Some MCOs utilize software or AI to complete this task, and some still do this manually by employee review. Billing delays can also be caused by things out of an MCO’s control - like missing claim or provider numbers, invoicing the wrong MCO, insufficient documentation, etc. These errors typically occur on the provider side, and the MCO must contact the provider to get it corrected before submitting.
Provider Bill Accuracy scores an MCO on the accuracy of bills submitted to BWC for payment. Only specific errors outlined by BWC count as an error here. The score given is a percentage of an MCO’s correct bills submitted during a certain time period. For example, if an MCO had 1000 claims at that time and only four claims with errors, their score would be 99.6%.
MCO Penalties
Capacity – This means an MCO cannot accept new employer assignments, and it can be implemented either by the MCO themselves, or by BWC. There are over a dozen reasons that this may occur, but the more likely culprits are violating BWC’s MCO marketing rules, unresolved weaknesses identified in compliance reports or audits, FROI turnaround over 2.5 days, or a major vendor change (such as a software) that could create volatility in everyday operations.
Setoff – BWC can deduct from an MCO’s fee payments for things like FROI timing averaging over 12 days, provider billing averaging over 8 days, FROI system data accuracy under 94%, bill payment accuracy, and audit compliance.
Withhold - BWC can withhold all or a portion of an MCO’s fee payment for “substantial failure” on the MCO’s part to fulfill its contractual obligations, or for the inappropriate approval of medical, non-medical and rehab services.
Finally, the Employer Satisfaction Survey. The clinical and administrative benchmarks in the first five categories may not resonate with employers, since they’re not a big part of the day-to-day relationship between the employer and their MCO. MCOs were created by BWC to outsource the medical management of workers’ comp claims in Ohio. They’re all held to the same set of rules, with the same basic services expected out of each company. The level and quality of customer service is where many employers may notice a difference from one to the next. These scores are derived from surveys completed by Ohio BWC policyholders with at least one lost time claim. Employers rate their MCO on a scale of 1 to 5 (1 being worst and 5 being best) in categories like response times, help with return-to-work strategies and programs, professionalism and case management.
You can view the 2023 BWC MCO Report Card here.